Crash Logs
Overview
Crash logs are valuable diagnostic tools that help developers identify and fix issues and bugs causing the application to crash or behave unexpectedly. Sharing logs from your device with the OsmAnd development team is possible. If OsmAnd closes unexpectedly, the app also offers to send a crash report the next time it starts.
Crash and App Logs
OsmAnd allows you to send two types of data to developers:
- Crash logs. Generated when the OsmAnd app encounters a critical error or exception causing it to crash. These logs provide detailed information about the application's state during the failure, including build data, stack traces, error messages, and other relevant details.
- Current session/app logs. A record of the OsmAnd log stream capturing various events and messages. These logs help developers monitor app behavior, track execution flow, trace specific actions, and investigate non-crash-related issues. Logcat logs usually contain records of activity from the time the app was last started.
Be cautious when sending app logs, as they may contain private information such as device location, search queries, route-building results, and navigation data.
Send Logs from OsmAnd App
- Android
- iOS
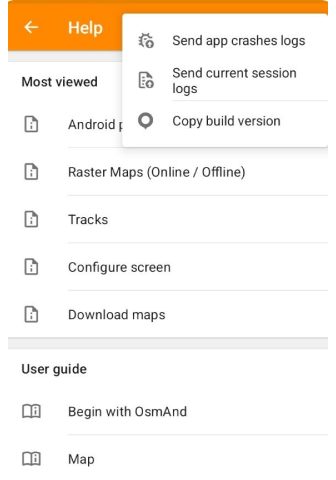
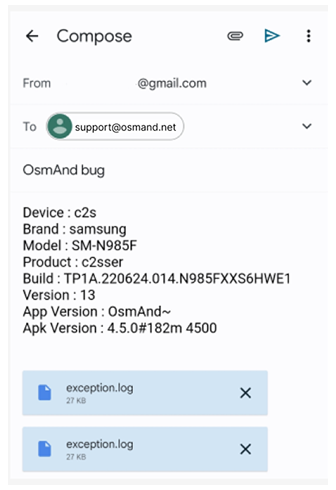
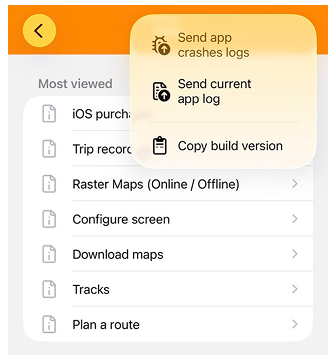
- Go to Menu → Help → Send app crashes logs or Send current session logs (Android)/Send current app log (iOS). Depending on your situation, select the appropriate type of log. You can refer to the section Crash and App Logs for details on the differences between the log types.
- In the pop-up menu, choose Gmail or your preferred email app. We recommend sending the logs to
support@osmand.net. - Tap the Send button.
Send Crash Report After a Crash
- Android
- iOS
If OsmAnd closed unexpectedly during the previous run, the Crash dialog appears the next time you start the app. It appears after the app crashes, after it stops responding (Android 11 and later), or after a crash in the app’s native code (Android 12 and later). The dialog does not appear while navigation is active.
- Send — sends the crash report directly to the OsmAnd development team, without using an email app. A message confirms whether the report was sent.
- Dismiss — closes the dialog without sending the report.
The report contains technical information about the app’s state and memory use before the crash, along with the app’s recent log.
If OsmAnd closed unexpectedly during the previous run, the Share crash log dialog appears the next time you start the app. It appears after the app crashes or after the system closes it unexpectedly.
- Send — sends the crash report directly to the OsmAnd development team, without using an email app. A message confirms whether the report was sent.
- Cancel — closes the dialog without sending the report.
The report contains technical information about the app’s state and memory use before the crash, along with the app’s recent log.
Heap Histogram for Memory Problems (Android)
A heap histogram is a table of what fills the app's Java memory: class names with object counts and sizes. It helps developers find what uses up memory when the app gets slow, freezes, or closes after a while. It does not contain your locations, track names, or search queries. OsmAnd takes a full memory dump on the device, turns it into the histogram, and deletes the dump right away.
Taking the dump freezes the app for 5–10 seconds. If you touch the screen during that time, Android may show OsmAnd isn't responding. That is why automatic collection is turned off by default.
When to turn it on:
- OsmAnd closes by itself or shows isn't responding again and again, especially after some time of use or when you open search, the map with many POIs, or My Places with many tracks.
- The app gets slower the longer it runs, and restarting it helps.
- The crash report says the app ran out of memory (
OutOfMemoryError). - OsmAnd support asked you to collect a heap histogram.
When to leave it off:
- Everyday use and navigation, when the app works fine.
- Crashes that happen right away at every start, or with a specific action like opening one file. A regular crash log is enough there.
How to collect and send it:
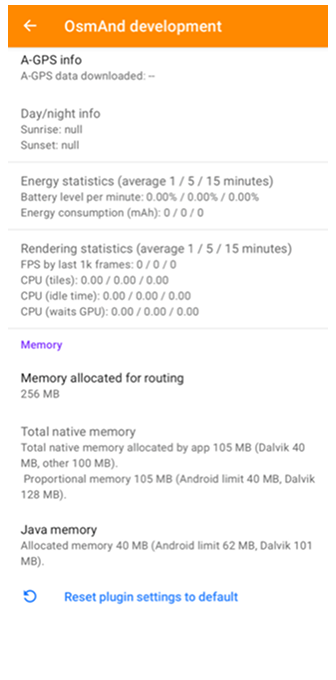
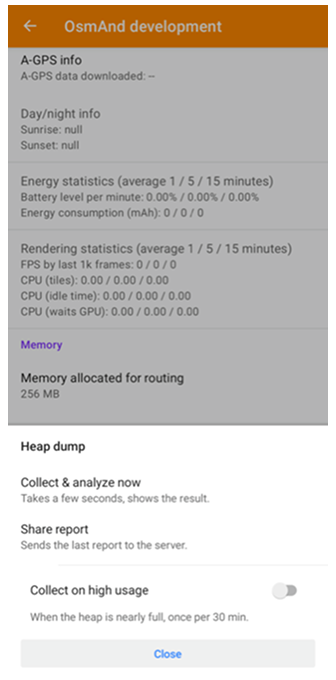
- Enable the OsmAnd development plugin and go to Main Menu → Plugins → OsmAnd development → Settings → Memory → Java memory.
- In the Heap dump panel, choose one of the following:
- Collect on high usage. The histogram is collected automatically when Java memory is nearly full, at most once every 30 minutes, and it is attached to the next crash report. Keep using the app as usual until the problem happens again.
- Collect & analyze now. Collects the histogram right away and shows the result. Use it when the app is already slow and Java memory shows high usage.
- Tap Share report to send the latest report to the developers, or send it from the crash dialog the next time the app starts.
- Turn off Collect on high usage once the report is sent.
Send Tombstone Files (Android)
For advanced users only!
In certain complex or unusual cases, Tombstone files may be required. These files provide detailed stack traces for all threads in a crashing process (not just the one that caused the error), a complete memory map, and a list of all open file descriptors. Tombstone files are vital for debugging and diagnosing issues related to native code on the Android platform.
Using Your Device
To export tombstone files, you need to generate a bug report using Android system settings:
-
Enable Developer options (this screen is hidden by default).
- Go to Settings → About phone → Software information (this path is valid for Samsung devices).
- Tap Build number seven times until a pop-up confirms developer mode is active.
-
Go to Developer options, usually located at the bottom of the settings list. You can also use the search function.
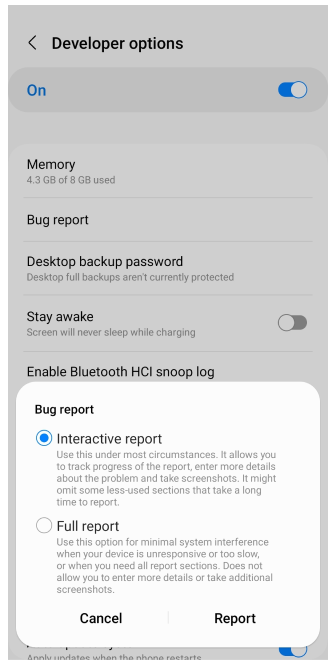
- Tap Take bug report option.
- Select the type of bug report and tap Report.
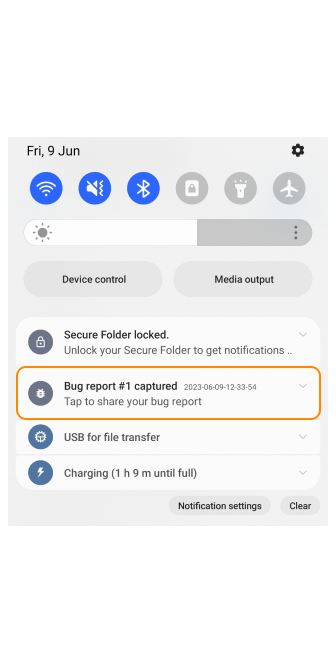
After the bug report is ready, you will receive a notification. Tap the notification box to download the report to your device. Unzip the file and send the tombstone files to the OsmAnd developers team (email: support@osmand.net).
Please note, that bug reports may contain private data, including app usage or location.
Using ADB
The Android Debugging Bridge (ADB) is a command-line tool that allows developers to debug their applications. To use ADB for exporting tombstone files, you'll need to download and install it first. Follow the instructions provided on the official Android developer site.
Prepare Your Device
Ensure Developer options are enabled (this screen is hidden by default) and USB debugging is turned on:
- Navigate to Settings → About phone → Software information.
- Tap Build number seven times until a pop-up confirms that developer mode is active.
- In the Developer options,enable USB debugging.
Then, connect your device to your workstation via USB. If it's the first time connecting, a pop-up will appear asking for permission to allow debugging.
Generate Bug Report
- Open a command line terminal. On Mac or Linux, use the Terminal app, and on Windows, use the Command Line.
- Navigate to the platform-tools folder where ADB is located using the cd command (for example, ‘cd /Users/Username/Downloads/Tools’).
- Generate the bug report:
- On Mac:
adb bugreport - On Windows:
adb.exe bugreport
- On Mac:
- Wait a few minutes for the report to generate. The resulting file will be saved in the platform tools folder.
- Unzip the file.
- Find the tombstones folder with files like tombstone_00, tombstone_01, and similar.
- Send the tombstone files to
support@osmand.net.
Using Rooted Devices or Android Studio Emulator
-
With root access to your device, you can directly open the /data/tombstones folder.
-
In Android Studio, use the emulator to navigate to Device File Explorer and find the /data/tombstones folder. Inside, you will find files named like tombstone_00, tombstone_01, and others. Download these files and send them to
support@osmand.net.
For more details on bug reports, refer to the Android documentation.